Runout Labs · General TerrainSample screen report · retrospective
Montecito front, Thomas Fire scar
Fire
Thomas Fire, December 2017
Burn input
BAER soil burn severity
Terrain
USGS 3DEP, 10 m
Canyons ranked
36
Public assets below the top six
563
Prepared
October 2026, as a sample
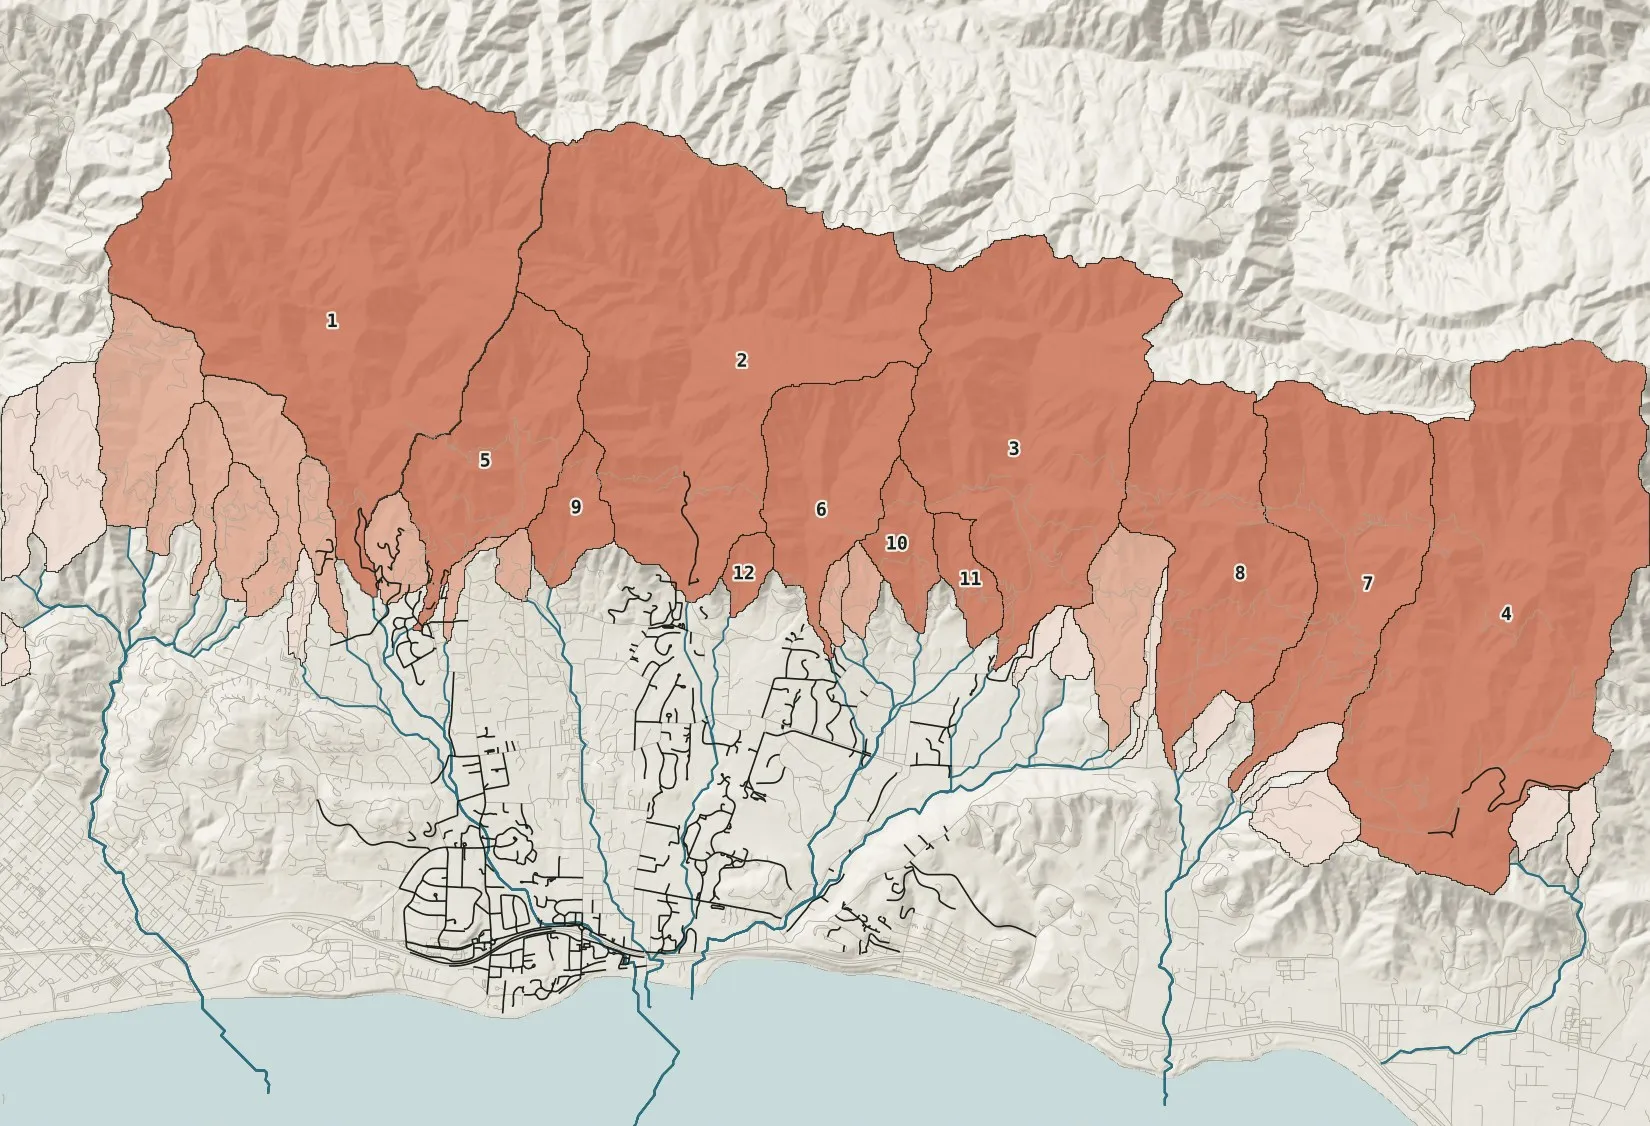
This ranks the canyons on the scar against each other, first to last, so a team knows which drainages to plan around first. It is not a probability or a volume, and it does not compare fires. This sample re-runs our method on the 2017 Thomas Fire; page 2 shows what happened on January 9, 2018.
Ranked in the top thirdMiddle thirdBottom thirdRoads below the top sixCreeks
The six canyons to plan around first
Rank
Canyon
Area
Burn
Slope
Public assets on the flow paths below
1
Cold Spring Creek
9.5 km²
0.55
32°
230 road segments, 40 power poles and linesincl. Olive Mill Road, North Jameson Lane, Hot Springs Road
64 road segments, 12 power poles and linesincl. Ortega Ridge Road, Winding Creek Lane, East Valley Road
4
Unnamed canyon
8.0 km²
0.31*
29°
3 road segmentsincl. Toro Canyon Park Road
5
Hot Springs Creek
2.2 km²
0.56
30°
23 road segmentsincl. Meadow Lane, Rockbridge Road, Clover Lane
6
Buena Vista Creek
1.8 km²
0.57
33°
40 road segmentsincl. Alisos Drive, Boundary Drive, Buena Vista Drive
* Under 80% of the canyon has a BAER severity class; the rest (outside the map, or masked as developed) counts as unburned. Burn is the mean BAER weight, 0 to 1.
Runout Labs · General TerrainMontecito front · Thomas Fire scar
All 36 canyons, ranked within this fire
#
Canyon
Burn
Slope
km²
1
Cold Spring Creek
0.55
32°
9.5
2
San Ysidro Creek
0.61
33°
7.8
3
Romero Creek
0.53
34°
5.2
4
—
0.31*
29°
8.0
5
Hot Springs Creek
0.56
30°
2.2
6
Buena Vista Creek
0.57
33°
1.8
7
—
0.38*
30°
3.1
8
—
0.36*
29°
3.3
9
Oak Creek
0.45
28°
0.6
10
—
0.36
30°
0.5
11
—
0.28*
26°
0.4
12
—
0.45
27°
0.2
#
Canyon
Burn
Slope
km²
13
—
0.12*
24°
0.8
14
—
0.25*
17°
0.4
15
—
0.29
27°
0.2
16
—
0.09*
19°
0.9
17
—
0.04*
31°
1.2
18
—
0.26
19°
0.1
19
—
0.17*
21°
0.1
20
—
0.07*
13°
0.3
21
—
0.03*
18°
0.4
22
—
0.01*
29°
0.4
23
—
0.02*
26°
0.3
24
—
0.05*
8°
0.1
#
Canyon
Burn
Slope
km²
25
—
0.00*
25°
0.9
26
—
0.00*
24°
0.4
27
—
0.00*
12°
0.1
28
—
0.00*
4°
0.1
29
—
0.00*
21°
0.1
30
—
0.00*
14°
0.1
31
—
0.00*
8°
0.1
32
—
0.00*
17°
0.1
33
—
0.00*
17°
0.2
34
—
0.00*
19°
0.5
35
—
0.00*
18°
0.2
36
—
0.00*
19°
0.1
Burn: mean BAER soil burn severity weight, 0 to 1 · Slope: mean gradient in degrees · Area: ground draining to the canyon mouth · * under 80% of the canyon has a BAER severity class; the rest counts as unburned, which can rank a canyon lower than it should be
What happened on January 9, 2018
123569
6 of 6 canyons that flowed were ranked in the top third (ranks 1, 2, 3, 5, 6, 9).
0.97 rank-AUC: a canyon that flowed outranks one that didn't in about 97% of pairings.
3.5 km² of debris-flow inundation mapped by USGS.
162 structures recorded as destroyed, of 558 in CAL FIRE's damage inspection.
How to read this
The ranking compares canyons within this fire only. It is never a probability, a volume, or a cross-fire comparison.
Rainfall is not an input. The ranking assumes the canyons get similar rain, which holds for a compact scar under one storm.
Area counts in full, so a large, moderately burned canyon can outrank a small, severely burned one.
The method is validated on one event, this one. How well it transfers is not yet established.
For likelihood and volume, USGS publishes the official assessments; we show them where they exist, attributed.
Sources
Terrain: USGS 3DEP, 10 m.
Burn severity: USFS BAER soil burn severity, Thomas Fire.
2018 debris flows, inundation, damage inspection and field photos: Kean, J.W., et al. 2018, USGS data release, doi:10.5066/P9JQJU0E; Kean, J.W., et al. 2019, Geosphere 15(4).