01
The next storm
- Weekly outlook
- Watch heads-up
- Close-out
- Storm record
The map shows what the fire did. The watch covers what comes next.
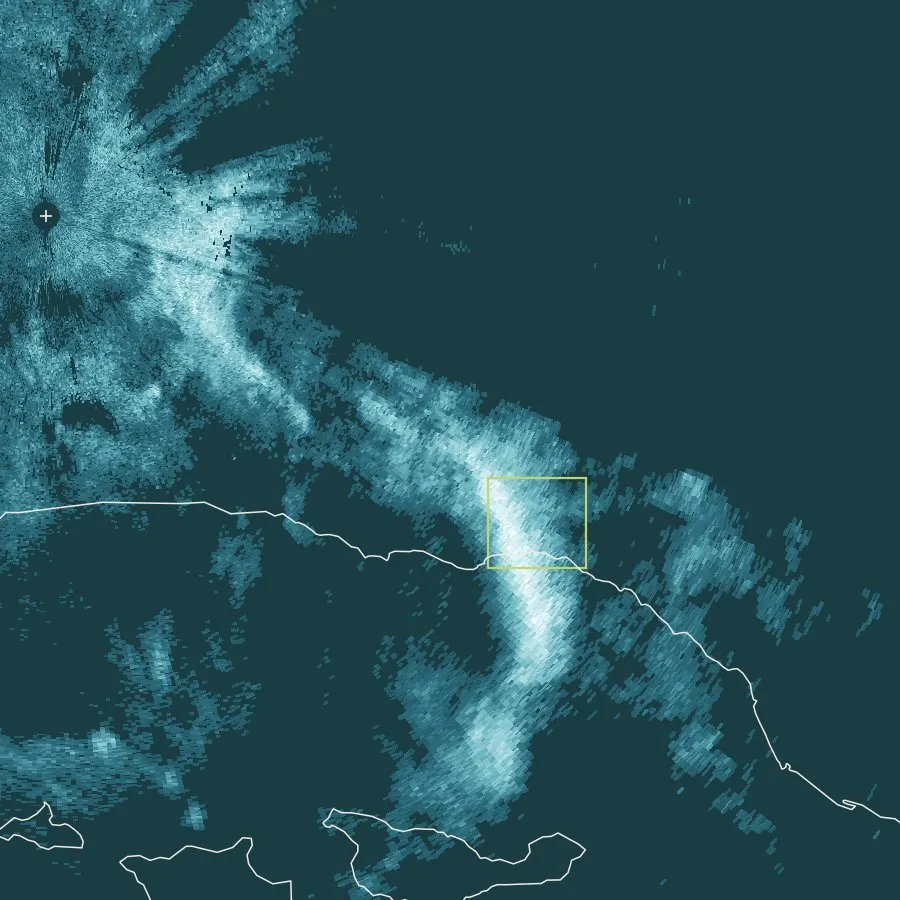
A replay of radar from January 9, 2018: a narrow band of heavy rain crosses the Thomas Fire scar between 3:27 and 3:48 AM, over the top-ranked canyons above Montecito.
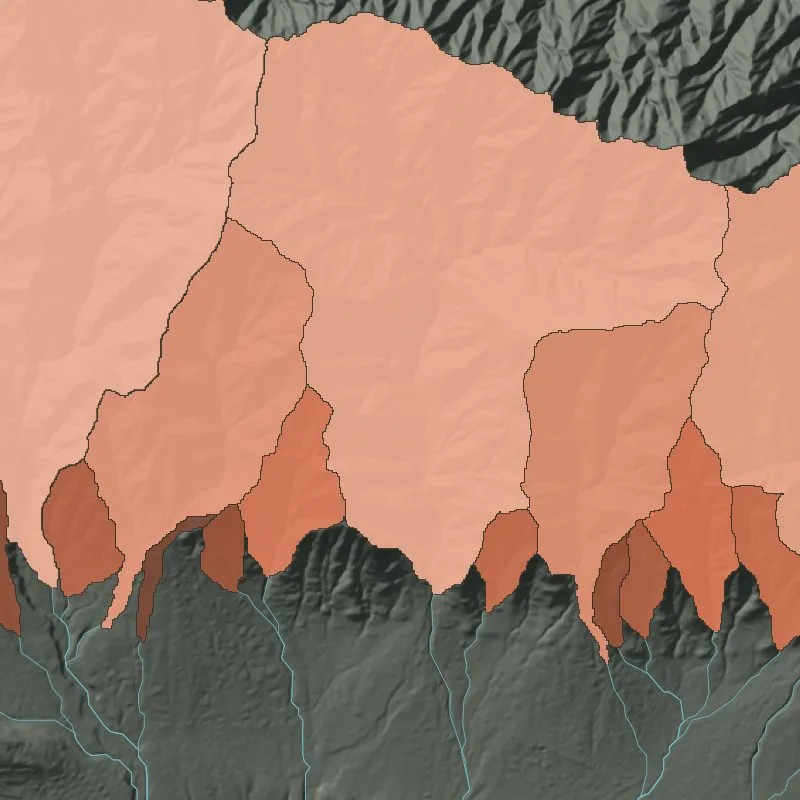
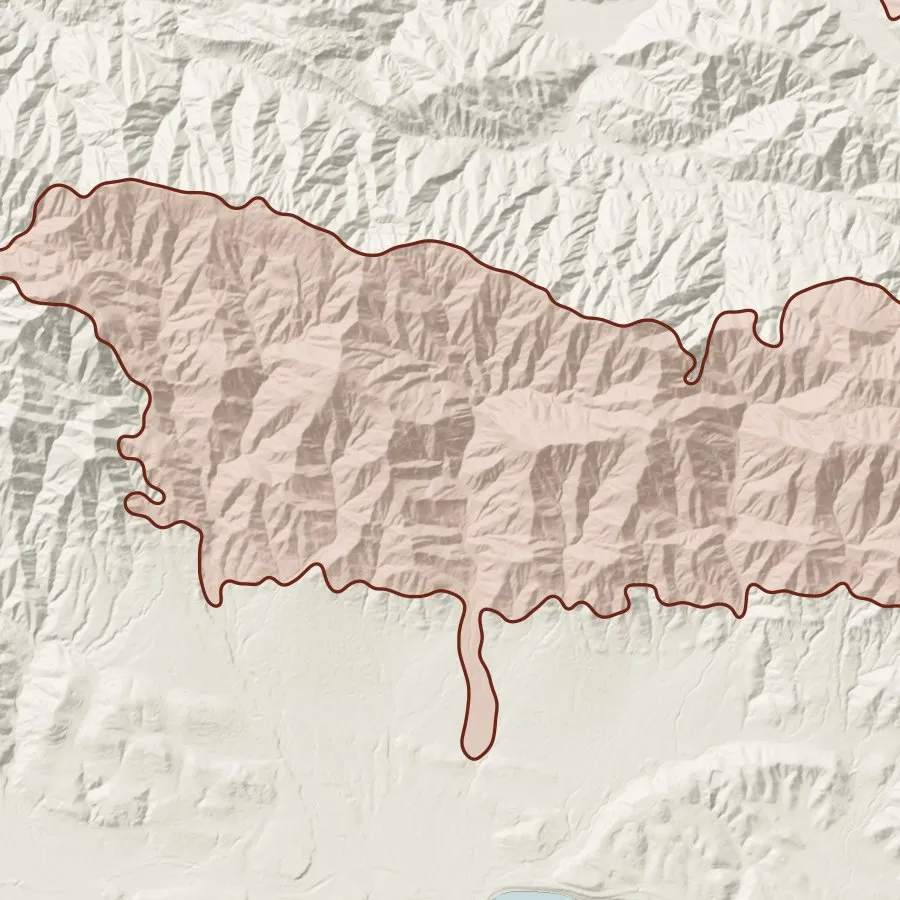
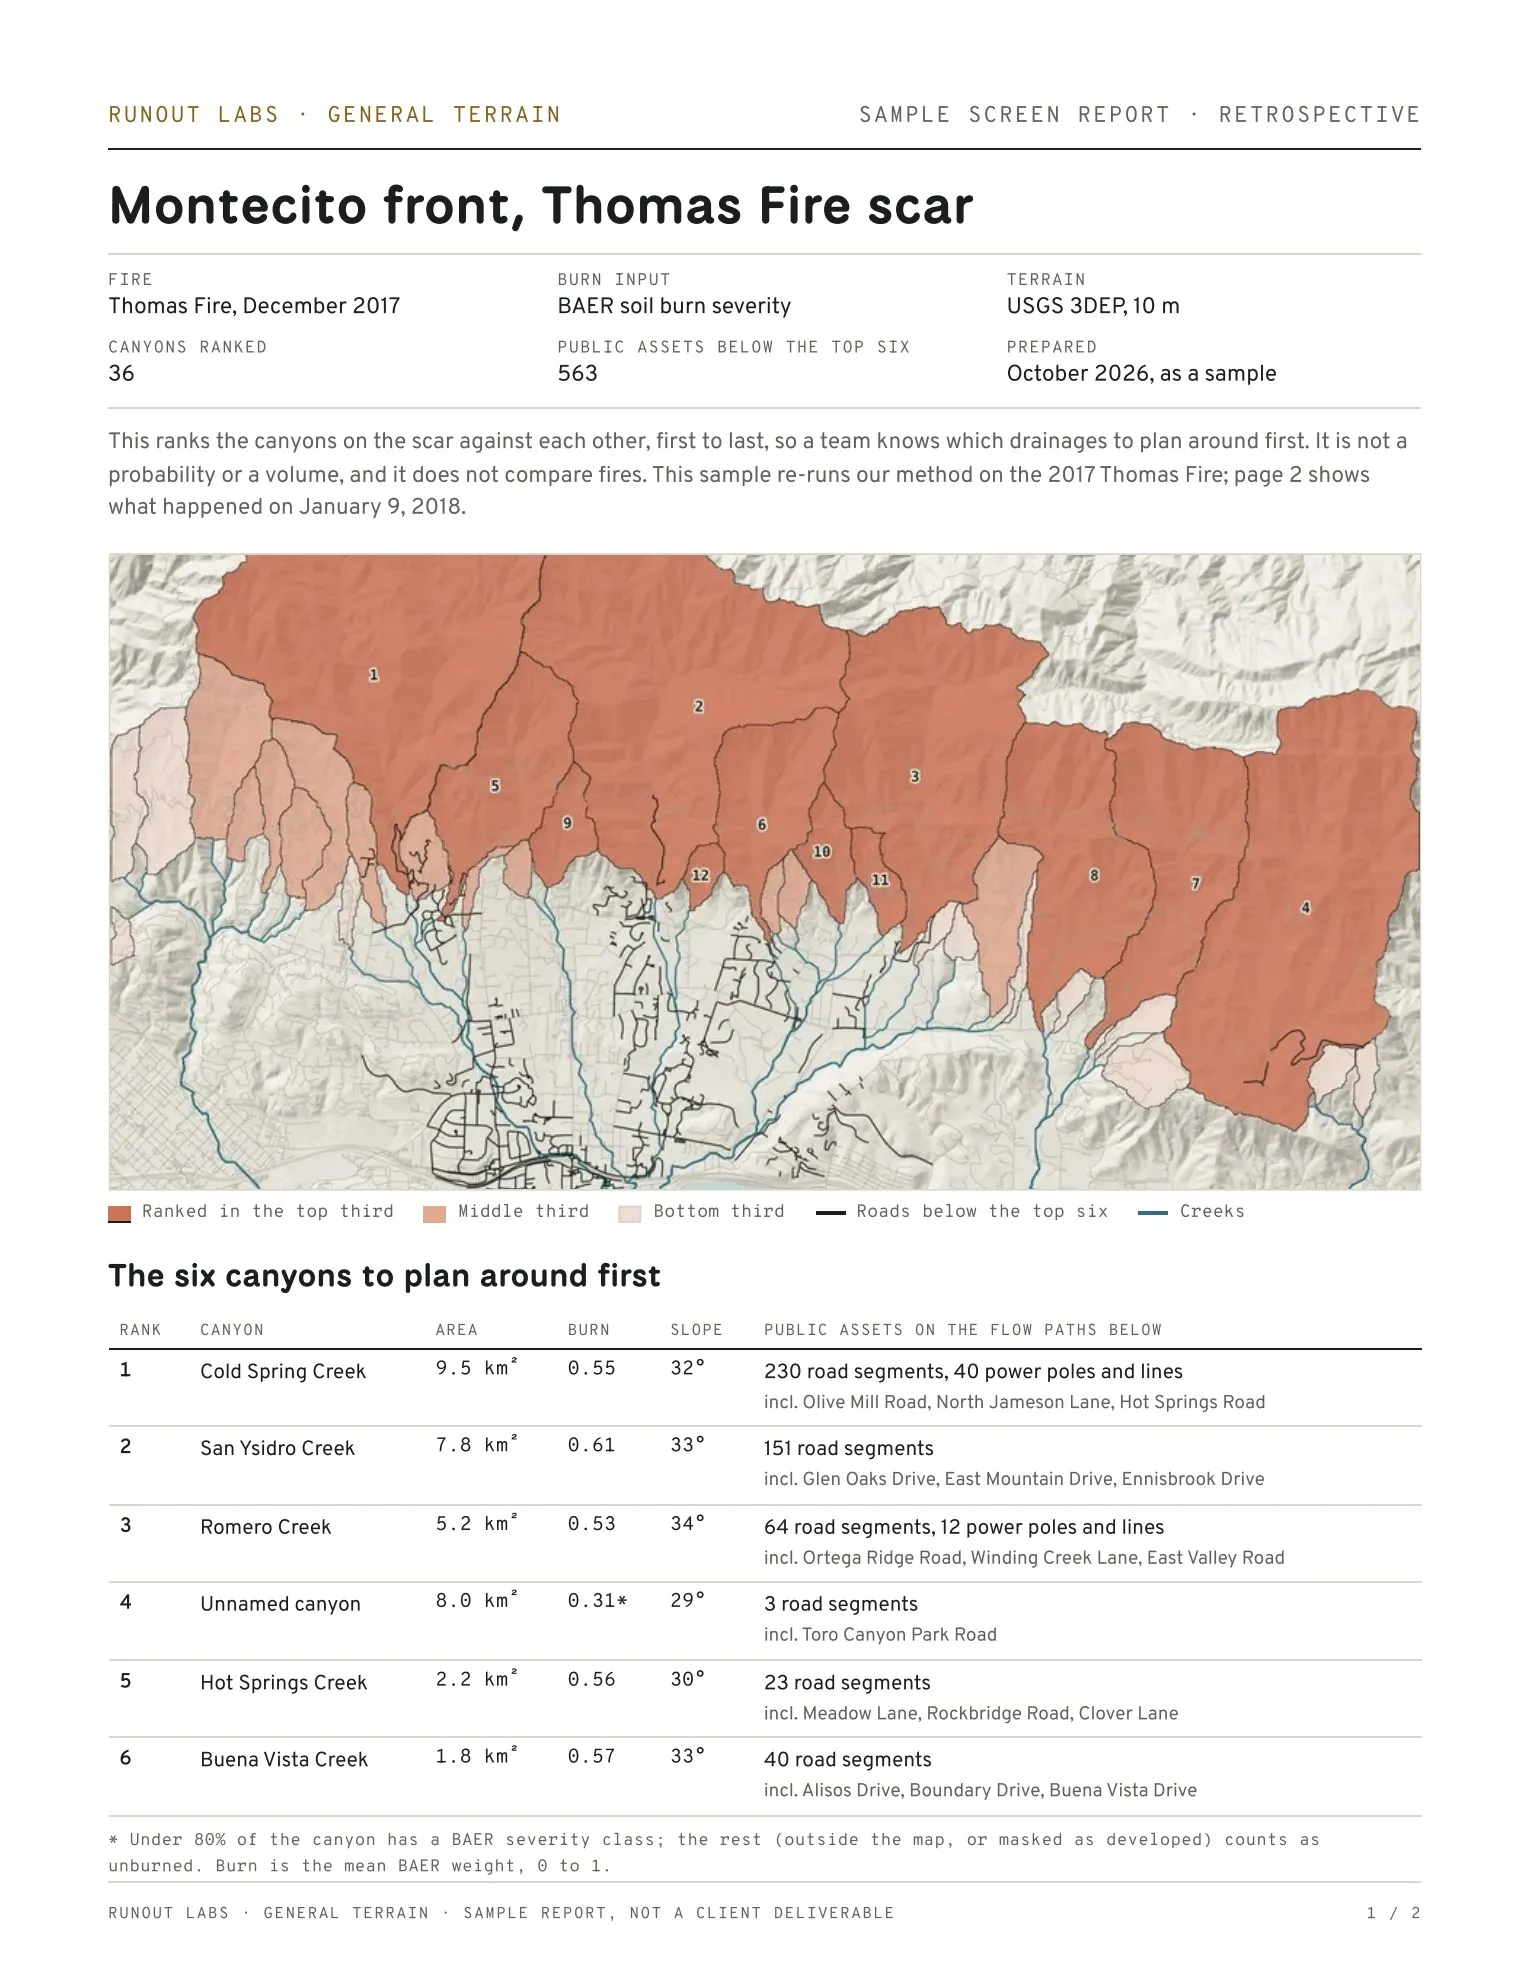
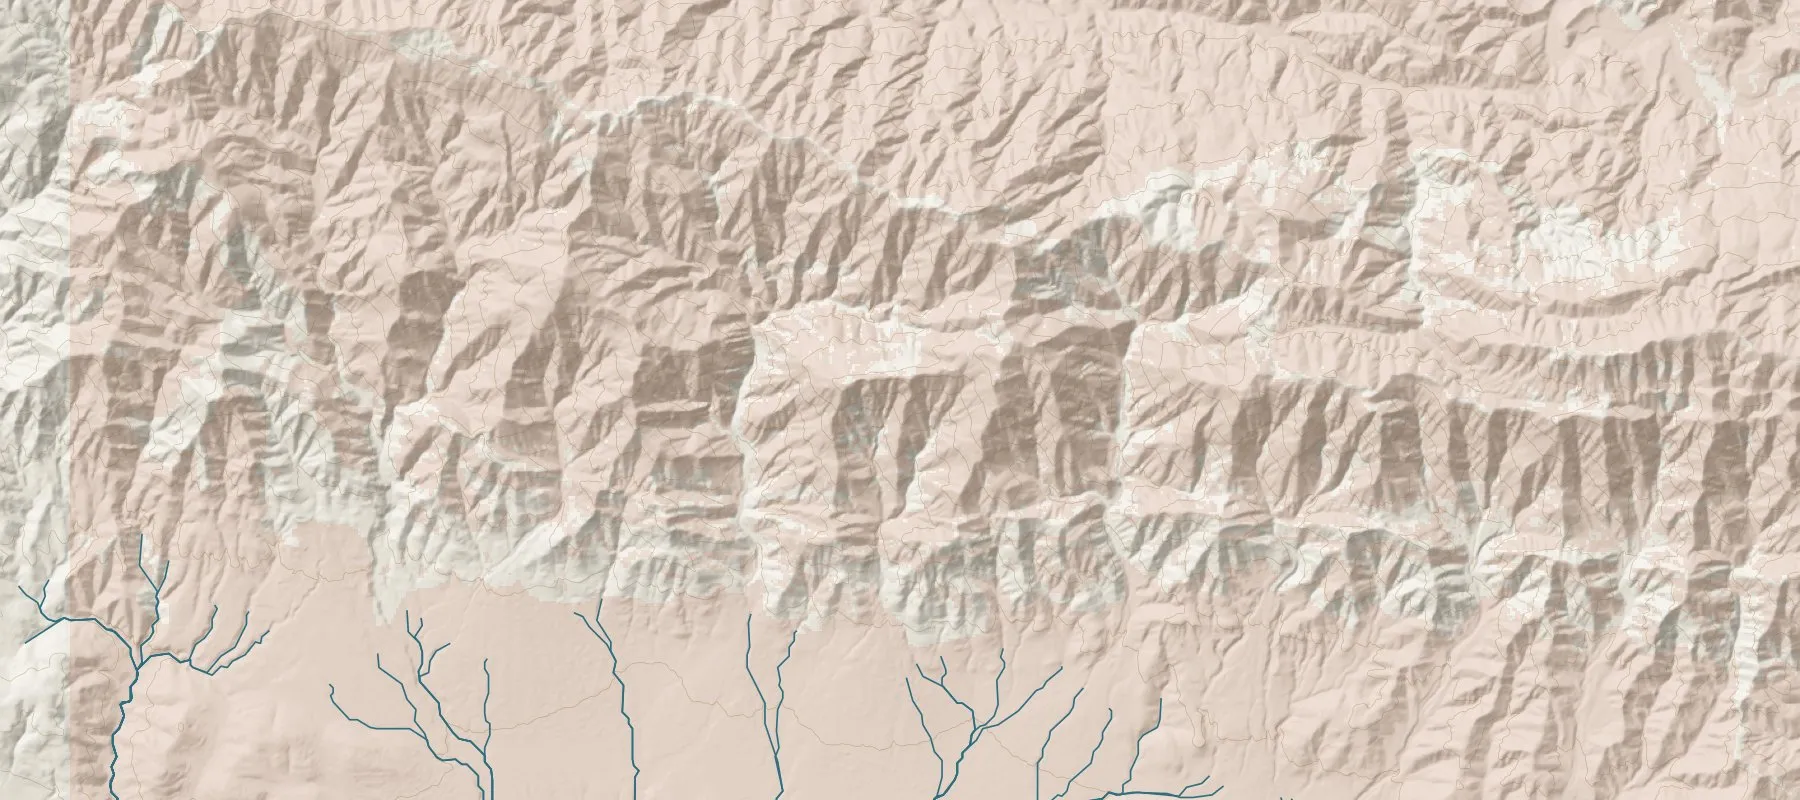
We combine burn severity, slope and the area draining to each canyon mouth. The result ranks the canyons below that scar against each other. It isn't a probability, and it doesn't compare fires. Read the method.
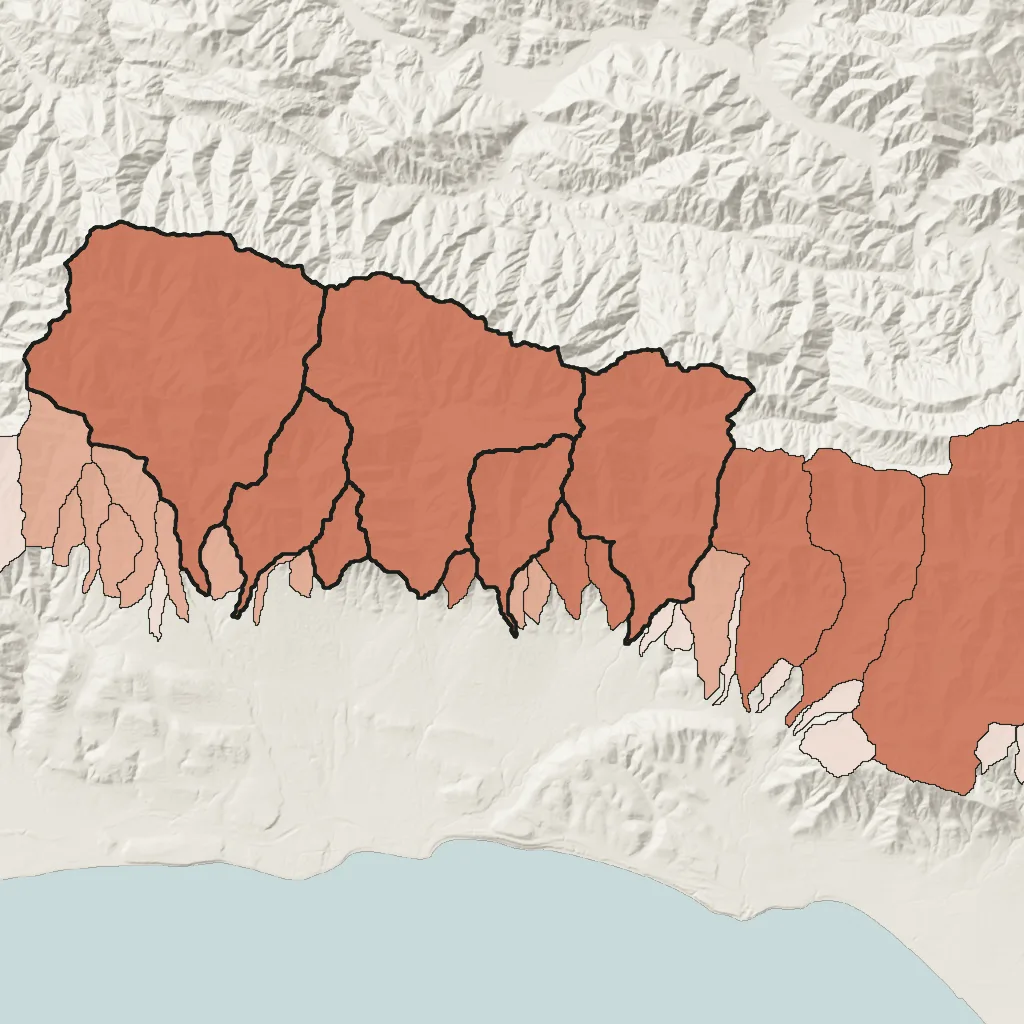 Drag to turn
Thomas Fire, Montecito front · BAER soil burn severity · 10 m USGS 3DEP · canyons ours
Years 0–2. Short, intense bursts of rain on bare soil cause runoff-generated debris flows.
Years 3–8. Long, soaking rain and snowmelt on slopes losing root strength cause landslide-initiated debris flows.
Sources: Rengers et al. 2020, Landslides · Thomas et al. 2021, JGR Earth Surface · USGS western Oregon root-strength study, Landslides 2025 · Graber et al., Geosphere. Root-decay timing comes from wet conifer forests; other vegetation is untested. The eight-year watch is how we schedule coverage, not a risk estimate.
Every watch starts with a 12-month page: what arrives and when, set to your storm seasons.
| Service | J | F | M | A | M | J | J | A | S | O | N | D |
|---|---|---|---|---|---|---|---|---|---|---|---|---|
| Storm season | Storm season in March | Storm season in April | Storm season in May | Storm season in July | Storm season in August | Storm season in September | ||||||
| Weekly outlook | Weekly outlook in March | Weekly outlook in April | Weekly outlook in May | Weekly outlook in July | Weekly outlook in August | Weekly outlook in September | ||||||
| Pre-season brief | Pre-season brief in February | Pre-season brief in June | ||||||||||
| Monthly status | Monthly status in January | Monthly status in February | Monthly status in March | Monthly status in April | Monthly status in May | Monthly status in June | Monthly status in July | Monthly status in August | Monthly status in September | Monthly status in October | Monthly status in November | Monthly status in December |
| Yearly re-screen | Yearly re-screen in June | |||||||||||
| Year-end record | Year-end record in November |
Example: an interior scar with spring melt and summer monsoon seasons · heads-ups, close-outs and storm records arrive when storms happen
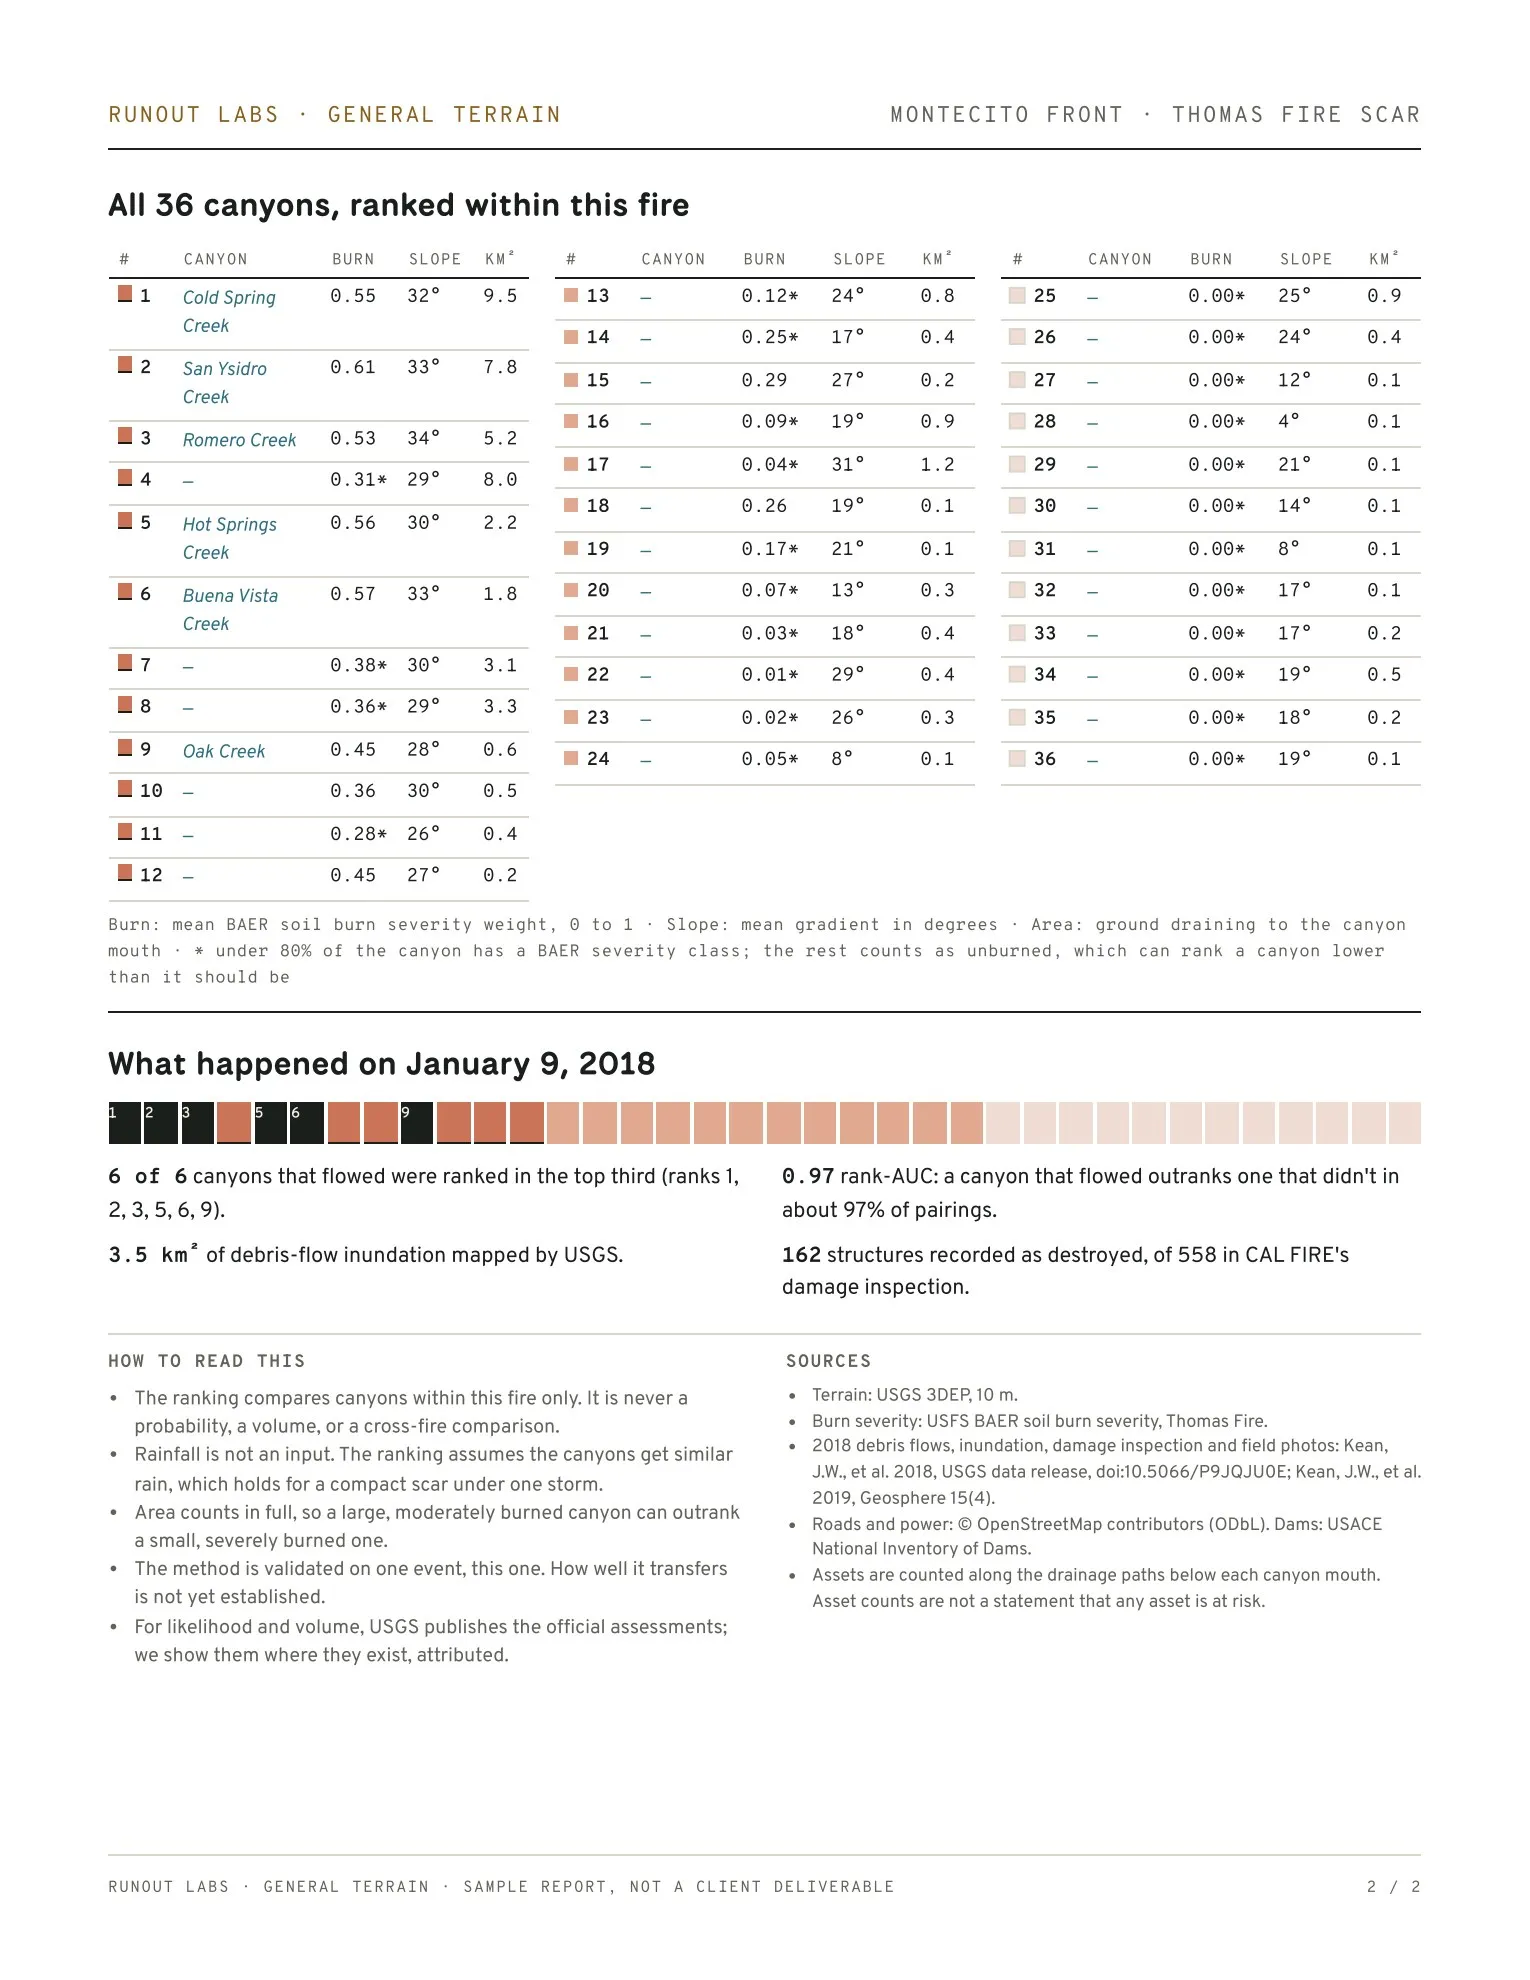
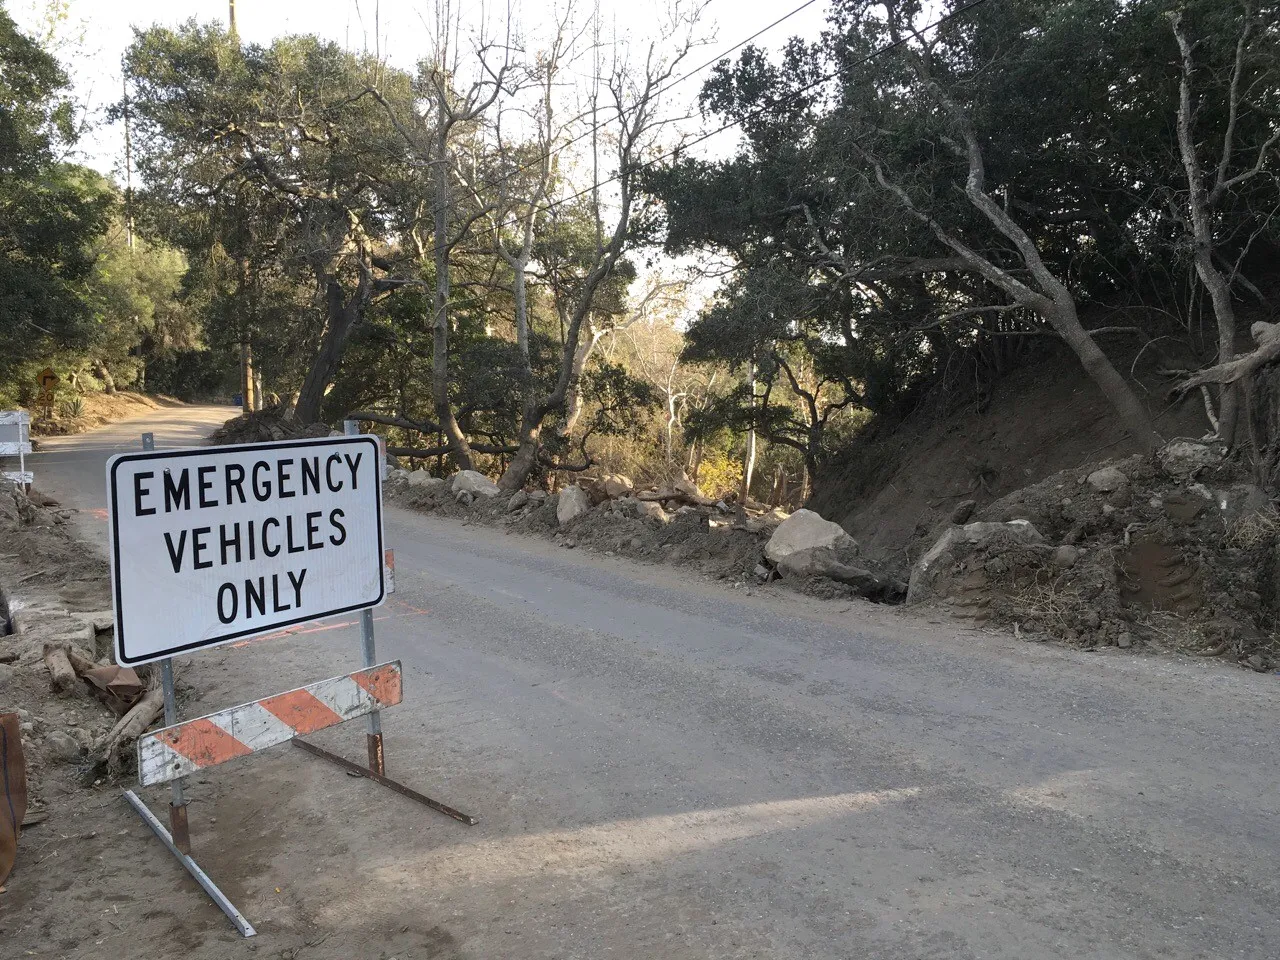
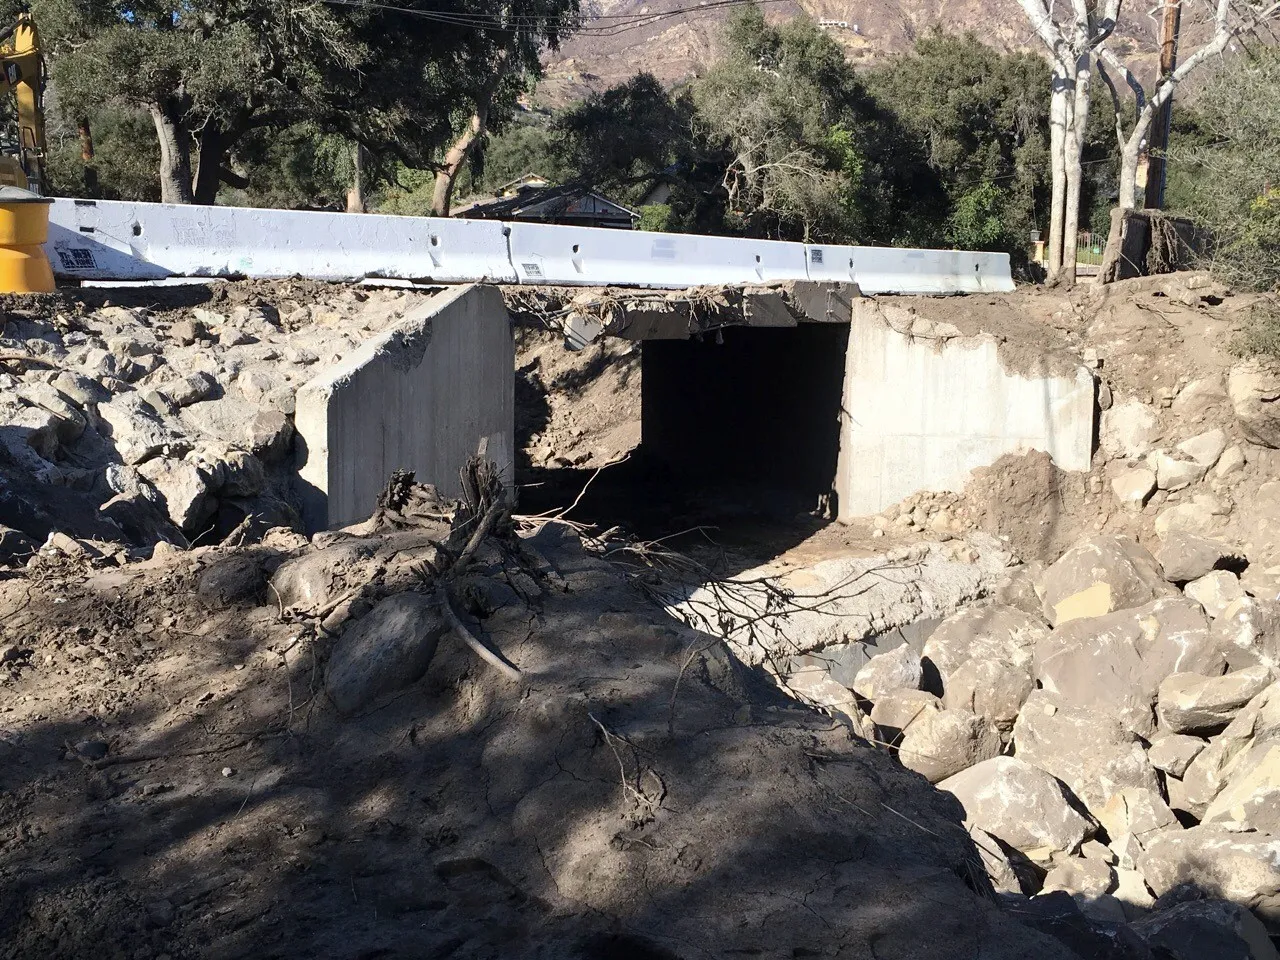
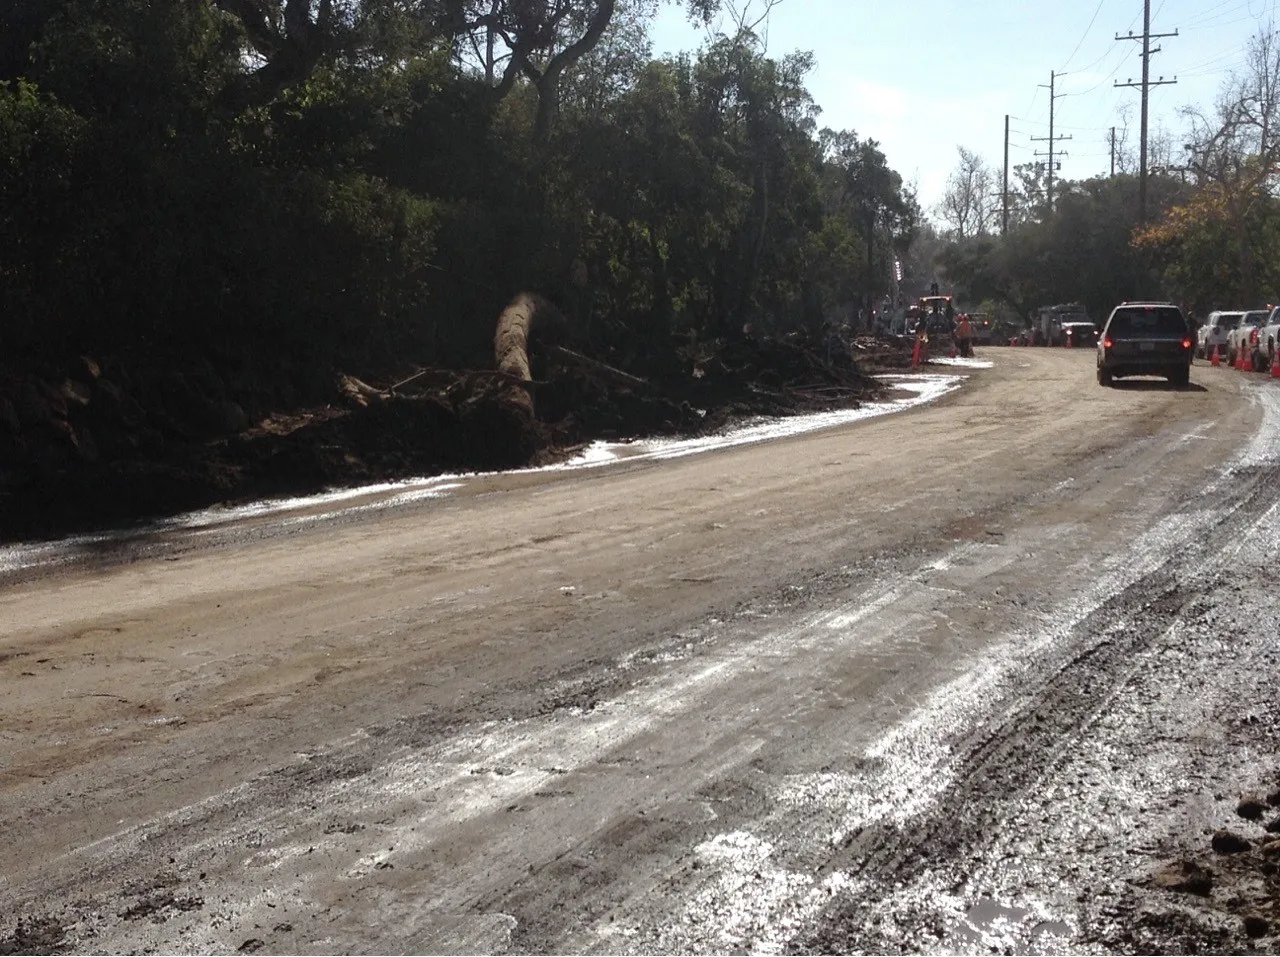
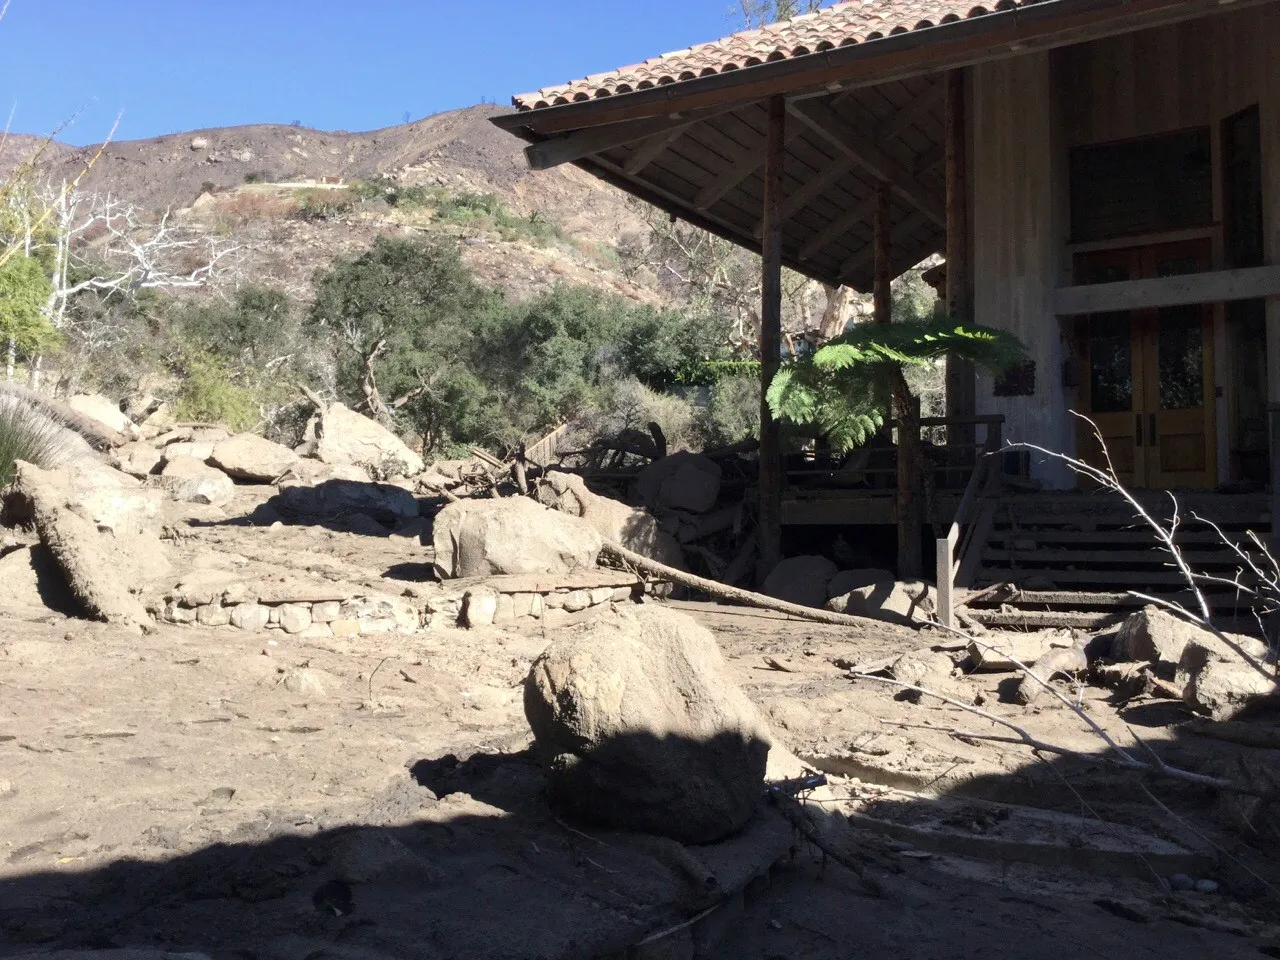
The 2017 Thomas Fire, screened the way we'd screen yours, then checked against what happened on January 9, 2018.