Updated logistic regression equations for post-fire debris-flow likelihood in the western United States.
Read the paper ↗Our ranking runs on public USGS data and methods. We tested it on a real event before offering it, and we list what it can't do.
We rank the canyons below one burn scar against each other. The ranking is relative to that fire. It is not a probability, a volume, or a comparison across fires.
| Canyon | 2018 | ||||
|---|---|---|---|---|---|
| 1 | Cold Spring Creek | 0.55 | 32° | 9.5 | Flowed |
| 2 | San Ysidro Creek | 0.61 | 33° | 7.8 | Flowed |
| 3 | Romero Creek | 0.53 | 34° | 5.2 | Flowed |
| 4 | Unnamed canyon | 0.31* | 29° | 8.0 | |
| 5 | Hot Springs Creek | 0.56 | 30° | 2.2 | Flowed |
| 6 | Buena Vista Creek | 0.57 | 33° | 1.8 | Flowed |
| 7 | Unnamed canyon | 0.38* | 30° | 3.1 | |
| 8 | Unnamed canyon | 0.36* | 29° | 3.3 | |
| 9 | Oak Creek | 0.45 | 28° | 0.6 | Flowed |
| 10 | Unnamed canyon | 0.36 | 30° | 0.5 | |
| 11 | Unnamed canyon | 0.28* | 26° | 0.4 | |
| 12 | Unnamed canyon | 0.45 | 27° | 0.2 | |
| 13 | Unnamed canyon | 0.12* | 24° | 0.8 | |
| 14 | Unnamed canyon | 0.25* | 17° | 0.4 | |
| 15 | Unnamed canyon | 0.29 | 27° | 0.2 | |
| 16 | Unnamed canyon | 0.09* | 19° | 0.9 | |
| 17 | Unnamed canyon | 0.04* | 31° | 1.2 | |
| 18 | Unnamed canyon | 0.26 | 19° | 0.1 | |
| 19 | Unnamed canyon | 0.17* | 21° | 0.1 | |
| 20 | Unnamed canyon | 0.07* | 13° | 0.3 | |
| 21 | Unnamed canyon | 0.03* | 18° | 0.4 | |
| 22 | Unnamed canyon | 0.01* | 29° | 0.4 | |
| 23 | Unnamed canyon | 0.02* | 26° | 0.3 | |
| 24 | Unnamed canyon | 0.05* | 8° | 0.1 | |
| 25 | Unnamed canyon | 0.00* | 25° | 0.9 | |
| 26 | Unnamed canyon | 0.00* | 24° | 0.4 | |
| 27 | Unnamed canyon | 0.00* | 12° | 0.1 | |
| 28 | Unnamed canyon | 0.00* | 4° | 0.1 | |
| 29 | Unnamed canyon | 0.00* | 21° | 0.1 | |
| 30 | Unnamed canyon | 0.00* | 14° | 0.1 | |
| 31 | Unnamed canyon | 0.00* | 8° | 0.1 | |
| 32 | Unnamed canyon | 0.00* | 17° | 0.1 | |
| 33 | Unnamed canyon | 0.00* | 17° | 0.2 | |
| 34 | Unnamed canyon | 0.00* | 19° | 0.5 | |
| 35 | Unnamed canyon | 0.00* | 18° | 0.2 | |
| 36 | Unnamed canyon | 0.00* | 19° | 0.1 |
Burn: mean BAER soil burn severity weight, 0 to 1 · Slope: mean gradient, in degrees · Area: km² draining to the canyon mouth · 10 m USGS 3DEP
* Under 80% of the canyon has a BAER severity class; the rest lies outside the BAER map or is masked as developed land. That ground counts as unburned, which can rank a canyon lower than it should be.
The USGS publishes the official likelihood and volume models. Where USGS has assessed a fire, we show its results next to our ranking, attributed to USGS. Our ranking never outputs either number.
| Our ranking | USGS likelihood (Staley et al. 2016) | USGS volume (Gartner et al. 2014) | |
|---|---|---|---|
| Gives | Relative rank within one fire | Likelihood, 0 to 1 | Volume, m³ |
| Calibrated | No | Yes | Yes |
| Burn input | Mean burn severity | dNBR | Moderate-to-high burned area |
| Slope | Mean slope | Share of area ≥ 23° | Relief |
| Rainfall | Not used | Rainfall accumulation | Peak 15-minute intensity |
Updated logistic regression equations for post-fire debris-flow likelihood in the western United States.
Read the paper ↗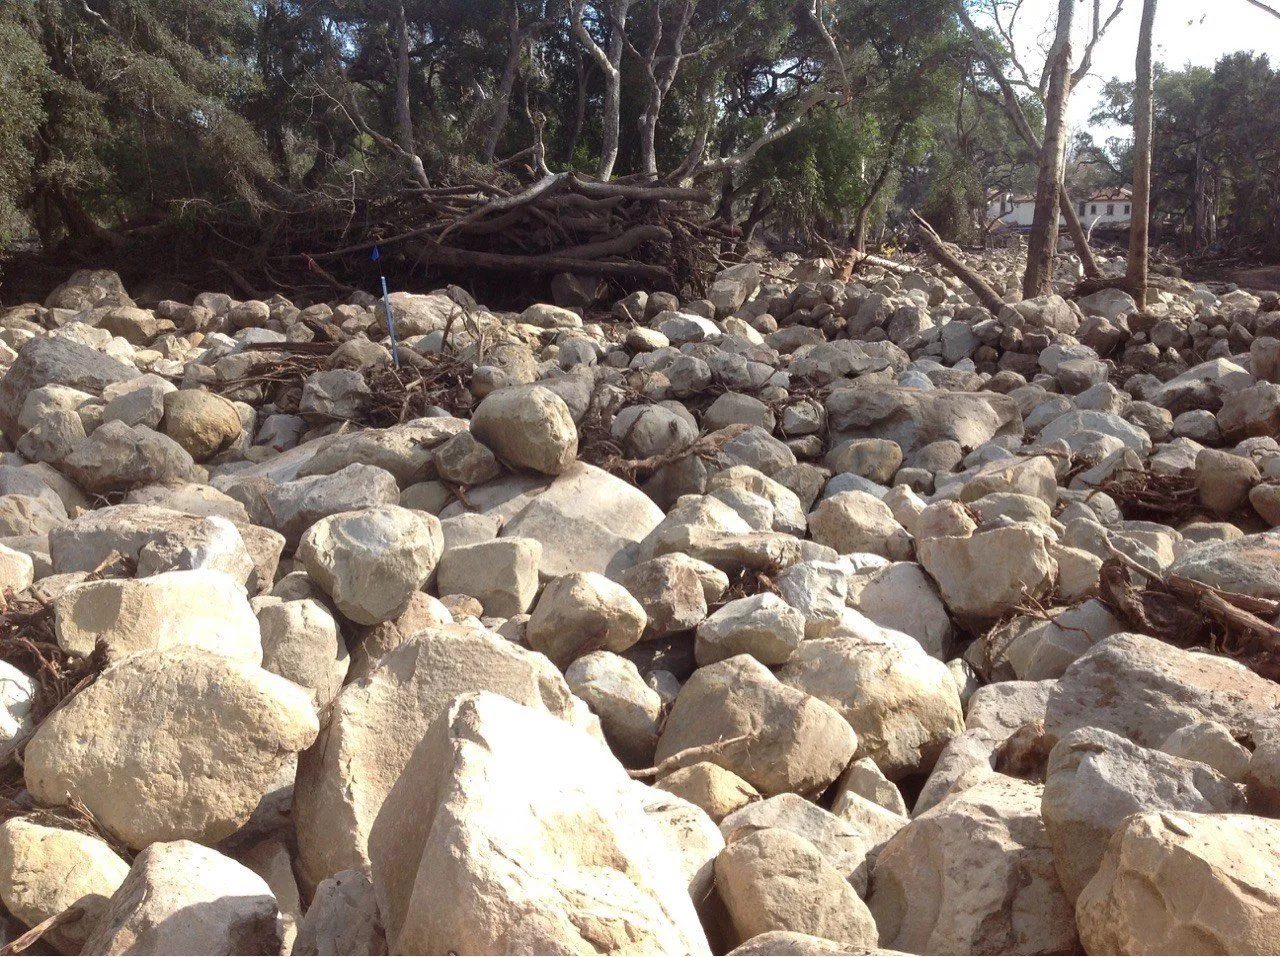
Empirical models for the volumes of sediment deposited by debris flows in southern California.
Read the paper ↗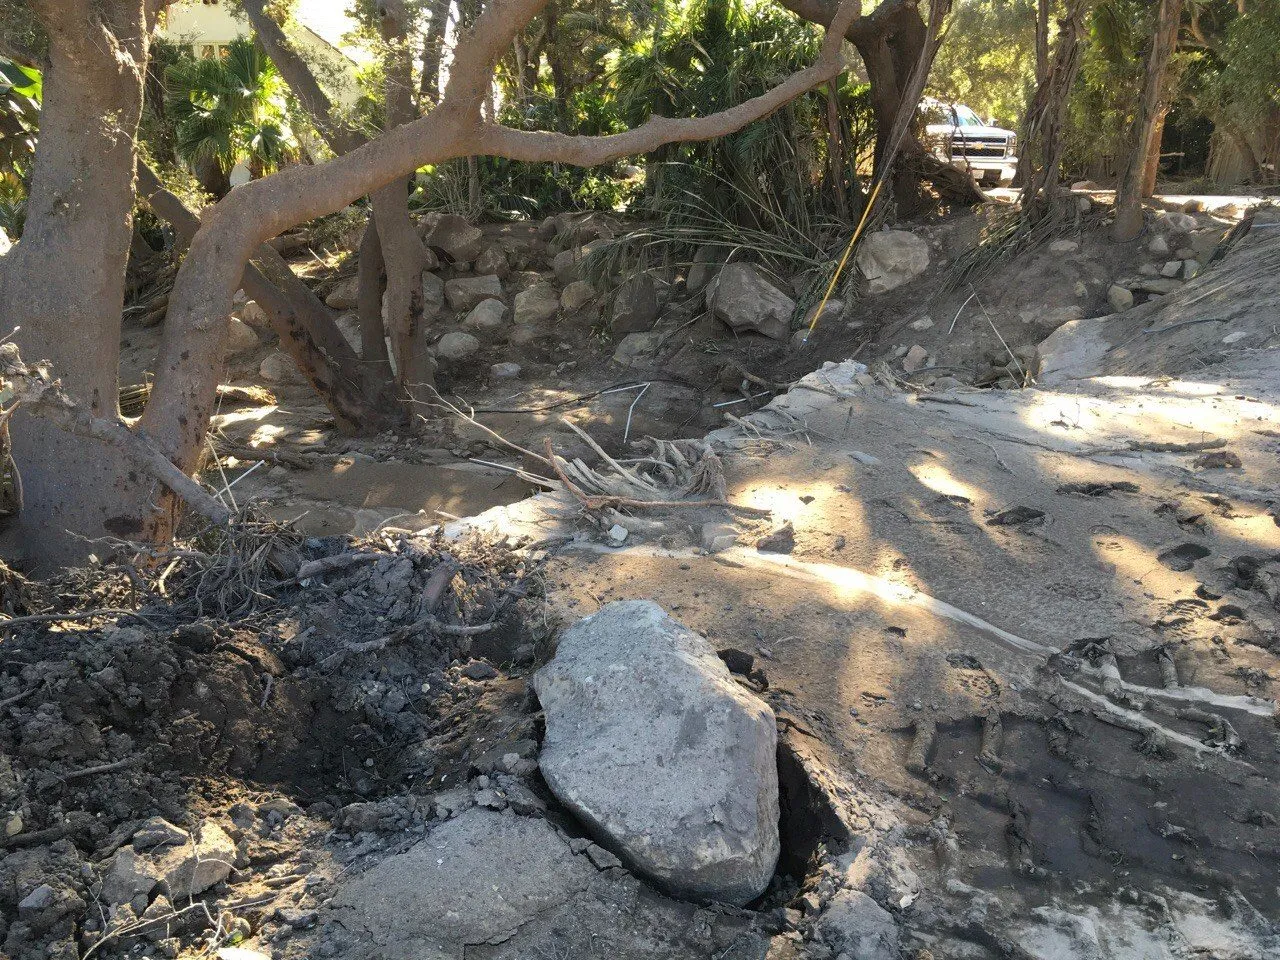
Probability and volume of post-wildfire debris flows in the intermountain western United States.
Link to confirmWe wrote down the test and the pass mark before running it, then ranked the Thomas Fire canyons and checked them against the USGS record of which canyons flowed on January 9, 2018.
Flowed, Jan 9 20181Cold Spring Creek2San Ysidro Creek3Romero Creek5Hot Springs Creek6Buena Vista Creek9Oak Creek
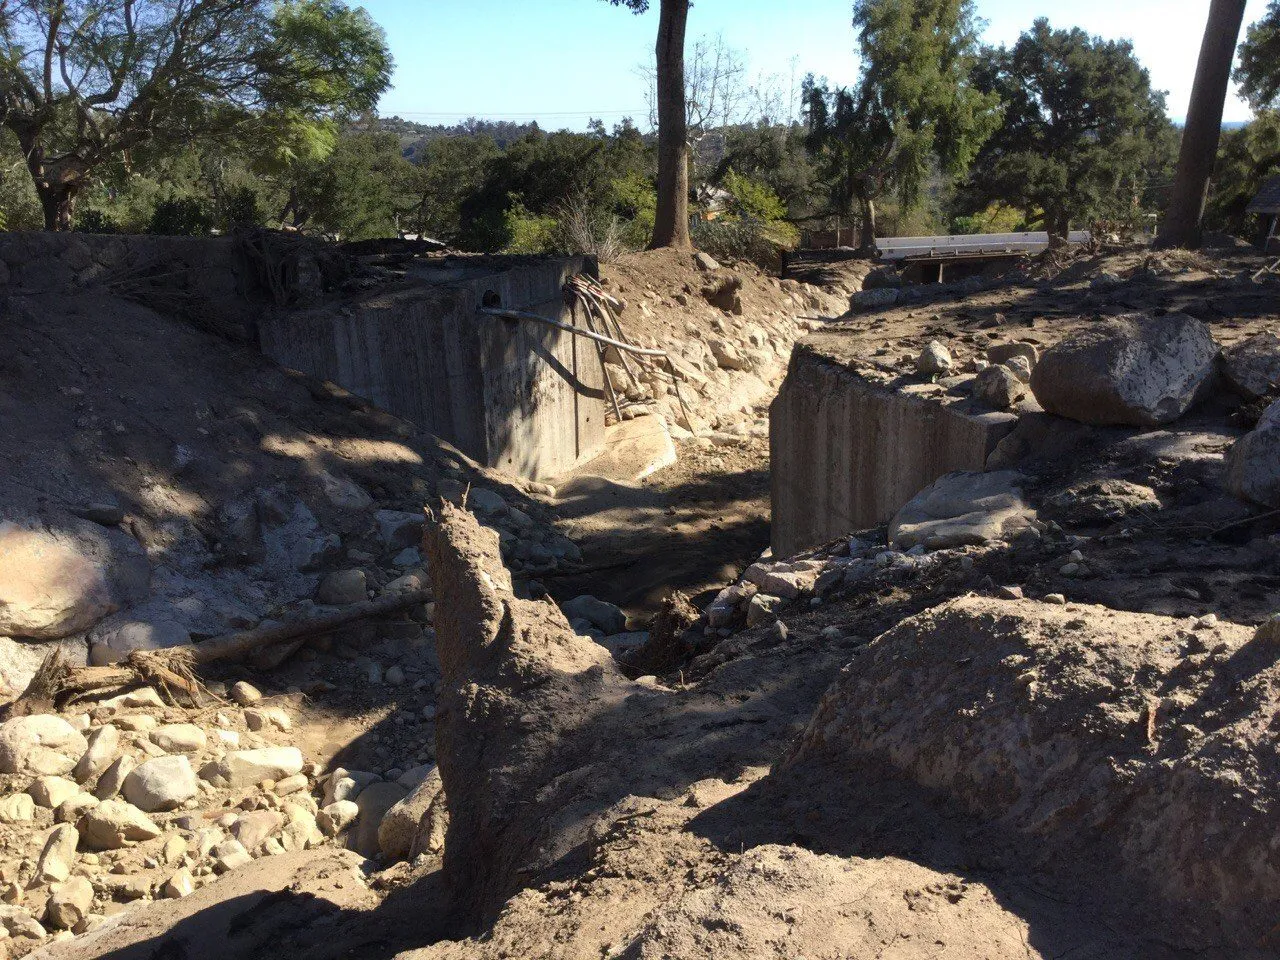
Inundation, flow dynamics, and damage in the 9 January 2018 Montecito debris-flow event. Our ground truth.
Read the paper ↗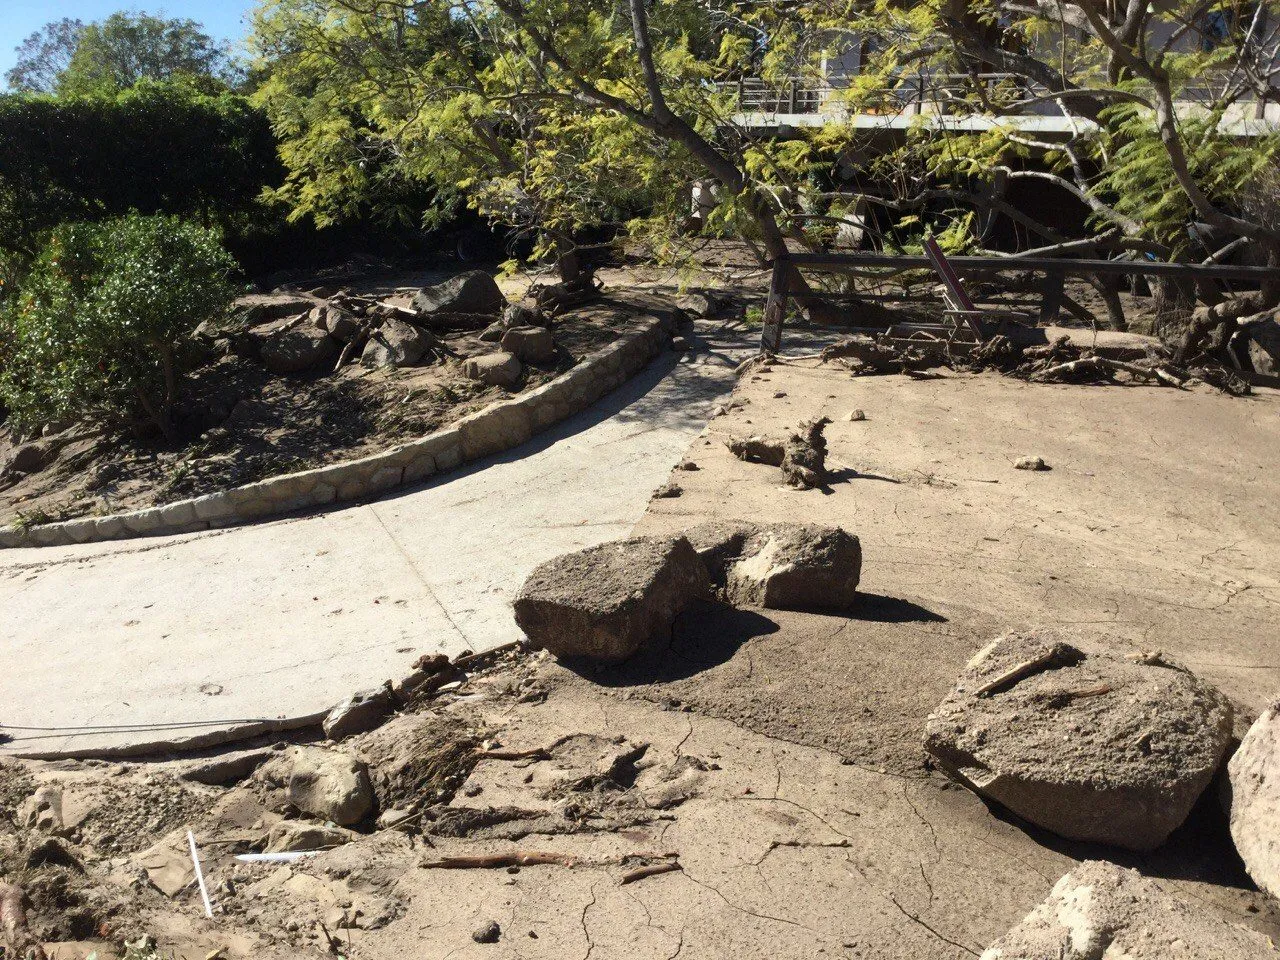
Inundation and damage data and field photos from the Montecito event. The photos on this site come from it.
See the data ↗The pre-registration, the pass mark, the result and the caveats.
Link to confirmThe validated Montecito ranking used BAER soil burn severity: the field-checked map federal BAER teams produce after large fires. When a fire has no BAER map, we compute burn severity from satellite images taken before and after it (dNBR). They measure different things, so we always say which one a ranking used.
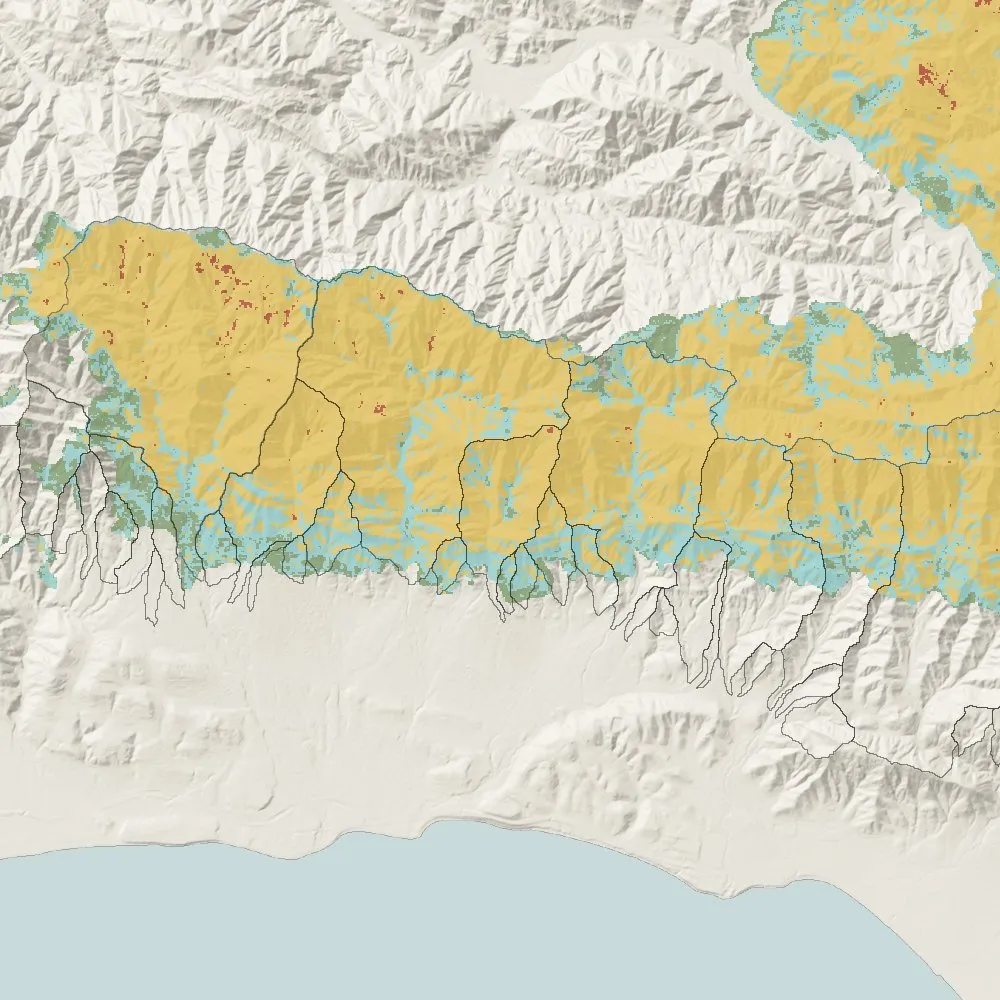
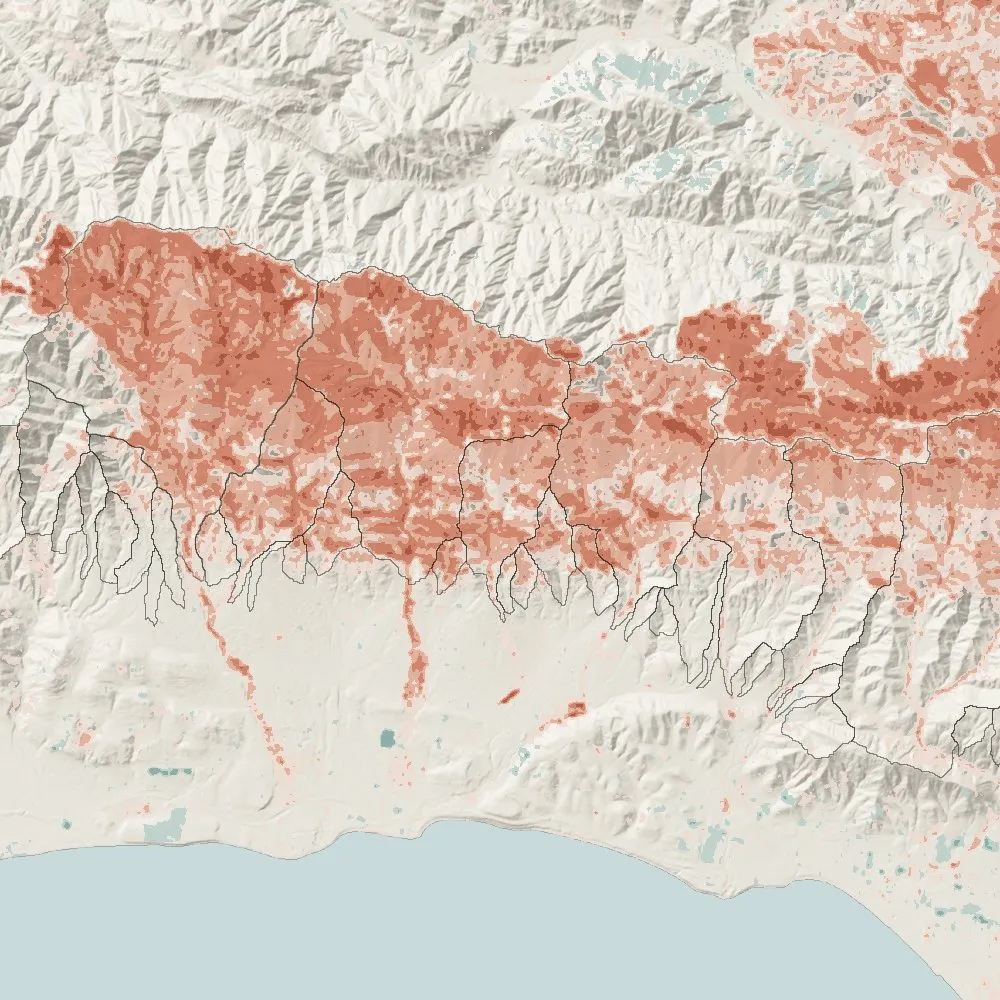
A generic first approximation. Published dNBR values vary by scene and are calibrated per burn against field plots.
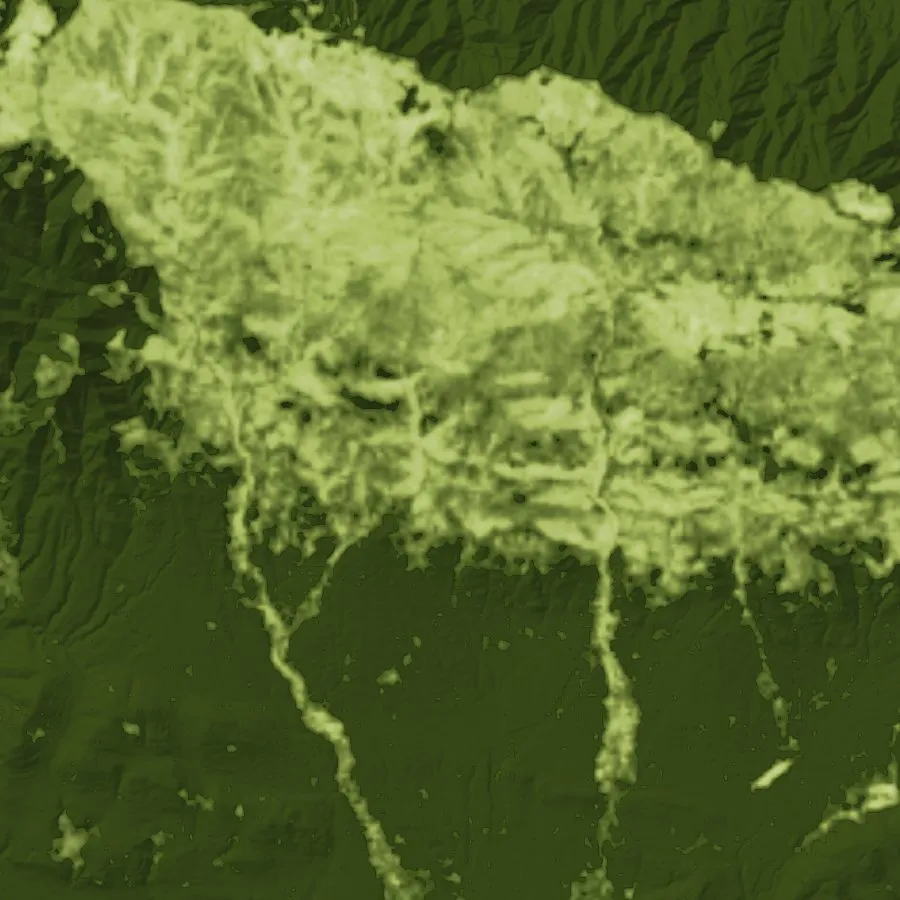
Landscape assessment: ground measure of severity and remote sensing of severity (FIREMON).
Link to confirm
The source of the first-approximation class breaks above.
Link to confirmWhere to start if you want the whole picture, and where our work stops: no one yet runs an operational assessment of where debris flows go once they leave the canyon.
Forecasting the frequency and magnitude of post-wildfire debris flows across southern California.
Link to confirm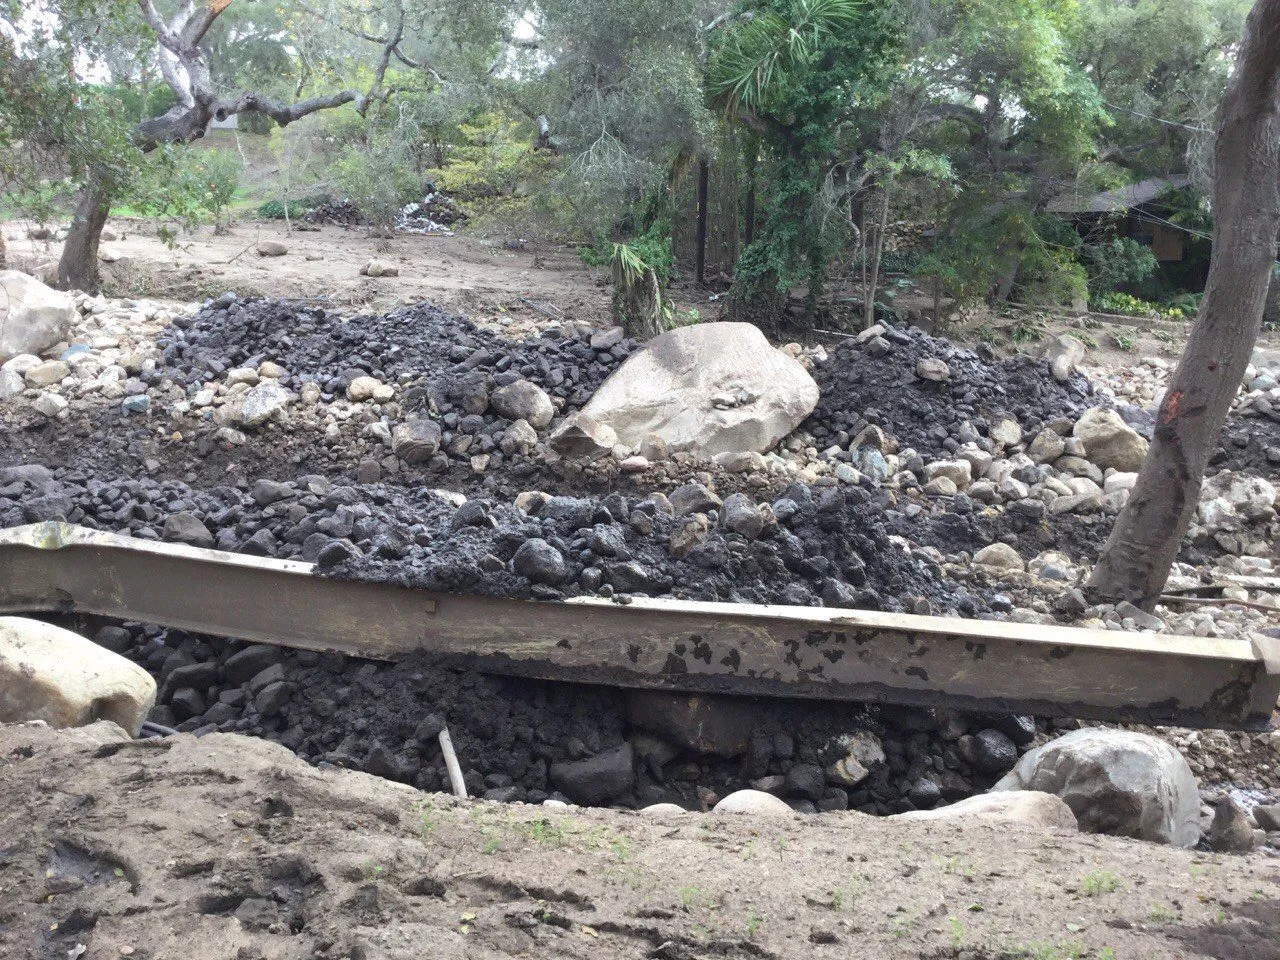
User needs for post-fire debris-flow inundation hazard products. Why we stop at the canyon mouth.
Read the paper ↗Landslides after wildfire: initiation, magnitude and mobility.
Read the paper ↗Post-fire soil hydraulic recovery tracks regrowth over three to four years.
Read the paper ↗Few debris flows occur once vegetation regains two-thirds of its pre-fire signal.
Read the paper ↗